Modelled Historical Data
Visit also the modelled historical data website, where you can download in csv format multi-year time series of meteorological fields from 2008 to 2010, with 2-km horizontal grid spacing and 10 min time resolution.
Questions & Answers
This page completes the information already available in the pages Methodology and Navigation help of the present web site.
- T1Q1 - Are the colour codes the same for all the tiles?
- T1Q2 - How long are the results averaged?
- T1Q3 - Can I use the information given on the web site to assess for the wind resources in a specific location?
- T1Q4 - I need monthly and/or daily wind data? Can I find them in the Wind Atlas?
- T1Q5 - How is the polar stereographic projection defined ?
- T1Q6 - What is the area covered by a tile ?
Topic 2 - Wind Roses and Wind Speed histograms
- T2Q1 - Does it make sense to compare the wind roses at different locations?
- T2Q2 - What is the quantity in the first column of the histogram files?
- T3Q1 - What is the turbine formula used for?
- T3Q2 - What is the meaning of the three wind turbine data required for the calculation of the turbine formula?
- T3Q3 - What are the Weibull parameters used for?
- T3Q4 - What is the Use factor obtained as a result of the turbine formula?
Topic 4 -MID/MIF and RPN files
- T4Q1 - Why are the tiles in the MID/MIF or RPN files bigger than the ones displayed on the web site? The tiles have an overlap, is it normal?
- T4Q2 - What variables are available in the MID/MIF and in the RPN files?
- T4Q3 - Are the data contained in the MID/MIF and in the RPN files the same?
- T4Q4 - What is the Coordsys clause specified at the head of the MIF files?
- T4Q5 - What is the procedure of import in MapInfo of the downloaded MID/MIF files ?
- T4Q6 - What is the procedure of import in ArcGIS of the downloaded MID/MIF files ?
Topic 1 - Generalities
T1Q1 - Are the colour codes the same for all the tiles?
Yes. This way the tiles can be compared.
T1Q2 - How long are the results averaged?
The definition of the numerical simulations performed to produce the Wind Atlas are based on a classification of the atmospheric states recorded every 6 hours during 43 years, from 1958 to 2000, and analysed. One can thus consider that the Atlas presents the wind statistical properties for this period.
T1Q3 - Can I use the information given on the web site to assess for the wind resources in a specific location?
The objective of the Atlas is to provide an overview of the wind resources of Canada and to highlight the regions that seem the most promising. However due to the limited resolution of the simulations (5 km), the direct use of the Atlas data for the evaluation of a specific site seems risky: it is well known that the local conditions (orography, vegetation) influence greatly the winds. But the Atlas is expected to be used as a basis for detailed wind resource assessment studies at a finer scale. Numerous private companies have an expertise in such studies (visit the Canadian Wind Energy Association web site).
Environment and Climate Change Canada is currently preparing, in collaboration with the National Research Council Canada, the release of a software based on the WEST technology (registration with an email added needed to access the web site) which integrates the meso-scale model MC2 and the micro-scale model MsMicro. This software will permit users to define wind maps at a site scale.
T1Q4 - I need monthly and/or daily wind data? Can I find them in the Wind Atlas?
No, because the Atlas only presents annual or seasonal results averaged over a 43-year period. The methodology used to produce the Atlas would allow to generate such data but the work has not been carried out yet and these data are not presently available.
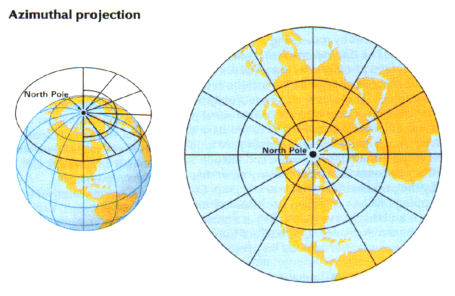
T1Q5 - How is the polar stereographic projection defined ?
The north polar stereographic projection is an azimuthal projection. It can be imagined as a plane surface crossing the earth surface. If a light source inside the globe projects the graticule onto the plane, the result would be a planar, or azimuthal, map projection.
In the Wind Atlas, we define that plane as the one crossing the earth at a latitude of 60 degrees North with a projection made from a point at the south pole (light source). This projection can be viewed as seeing the earth from above the North pole. This projection is convenient for domains close to latitude 60N toward the pole but deformations become important away from this latitude, especially going toward the equator. It is well suited for Canada.
We represent the earth as a sphere of radius Rt.
Let us consider a point on the earth surface located by its longitude
Λ and its latitude Φ. In the polar plane, this point will be
located by a radius (distance to the centre) and a polar angle Θ. The
following relations can be found:
- Θ = Λ (polar angle = longitude)
- radiusΦ0 = Rt cosΦ × ( 1 + sinΦ0 ) / ( 1 + sinΦ )
in which Φ0 is the latitude of the projection plane, Φ0 = 60 degrees for the Wind Atlas.
The map scale factor is the ratio of Δ(proj), the distance between
two points in the projection plane, with Δ(earth), the distance
between the corresponding points on the earth surface. It can be shown that
the map scale factor is:
- map scale factor = ( 1 + sinΦ0 ) / ( 1 + sinΦ )
With Φ0 = 60 degrees, one finds that:
at Φ = 60 degrees, map scale factor = 1, Δ(proj) = Δ(earth)
at Φ = 45 degrees, map scale factor = 1.136, Δ(proj) = 1.136 × Δ(earth)
at Φ = 75 degrees, map scale factor = 0.949, Δ(proj) = 0.949 × Δ(earth)
In MapInfo, the plane of projection is the polar plane with Φ0 = 90 degrees. A point on the earth
surface of coordinates (Λ, Φ) is located in this plane by:
- Θ = Λ
- radius90 = Rt cosΦ × ( 1 + sin90 ) / ( 1 + sinΦ )
Therefore, in order to get from this information the coordinates
(Θ,radius60) of the projection of the same point in the
60 degrees polar plane, one has to apply a stretch factor to
radius90 defined with:
- stretch factor = radius60 / radius90 = ( 1 + sin60 ) / (1 + sin90 ) = 0.933013
In MapInfo the stretch factor is called scale factor.
References:
Unesco Training Module on GIS
RPN.COMM
(registration with an email address needed to access the web site)
T1Q6 - What is the area covered by a tile ?
As the grid resolution of our simulations is 5 km and each tile includes 174 x 174 grid cells, each tile is normally 870 km large. But only the central part is shown on the web site (106 x 106 grid cells), the overlap region with neighbouring tiles being removed. Therefore, each image presented on the web site covers a 530 km x 530 km territory (106 x 5 = 530). (See also question T4Q1.)
But these distances should be understood as measured in the projection plane at 60 degrees North. In order to have the actual distances on the sphere, one should account for the map scale factor.
The map scale factor depends on the latitude Φ and is defined as:
map scale factor = Distance on the map / Distance on the sphere = ( 1 + sin 60 ) / (1 + sin Φ )
Therefore the resolution which is 5 km in the projection plane depends on
the latitude when measured on the sphere :
| lat = 60 degrees | map scale factor = 1. | resolution on the sphere = 5 km |
| lat = 40 degrees | map scale factor = 1.136 | resolution on the sphere = 5.68 km |
| lat = 75 degrees | map scale factor = 0.949 | resolution on the sphere = 4.75 km |
The size 530 km is the distance measured in the projection plane not on the sphere.
Consequently, in order to know the exact distances, it is recommanded to download the MID/MIF files for the tile of interest and use your favorite GIS software.
Topic 2 - Wind Roses and Wind Speed histograms
T2Q1 - Does it make sense to compare the wind roses at different locations?
Yes. The same scale is used for all the wind roses as long as the frequencies do not exceed 0.3. Otherwise, a specific scale is used and a warning message is displayed.
T2Q2 - What is the quantity in the first column of the histogram files?
The first column of the histogram files shows the wind speed class and not the wind speed itself. The wind speed classes are: class 0 - wind speed between 0 and 0.2 m/s, class 1 - between 0.2 and 1 m/s, class 2 - between 1 and 2 m/s, class 3 - between 2 and 3 m/s, ..., class 26 - wind speed of 25 m/s and over.
Topic 3 - Turbine Formula
T3Q1 - What is the turbine formula used for?
This simple formula provides an estimate of the power that would be produced by a wind turbine installed at the selected location. It is based on the mean wind speed taken from the Wind Atlas and on the wind turbine parameters entered by the user.
T3Q2 - What is the meaning of the three wind turbine data required for the calculation of the turbine formula?
These three parameters characterize the idealized power curve of a wind turbine.
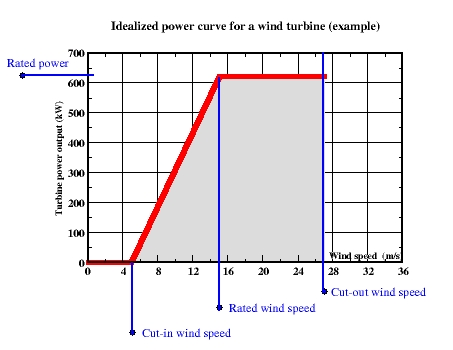
Max power output: or rated power of the turbine, the constant power output maintained above the rated wind speed.
Cut-in wind speed: wind speed at which the wind turbine is designed to start running.
Rated wind speed: wind speed at which the rated power is first achieved.
Although the cut-out wind speed (wind speed at which the wind turbine is stopped) must exist for safety, it has usually a small effect on the turbine average output and is not included in the calculation.
T3Q3 - What are the Weibull parameters used for?
The Weibull distribution is a theoretical distribution frequency = f(wind speed) which is a good approximation of most of the wind speed histograms. It includes two parameters: the shape parameter and the scale parameter.
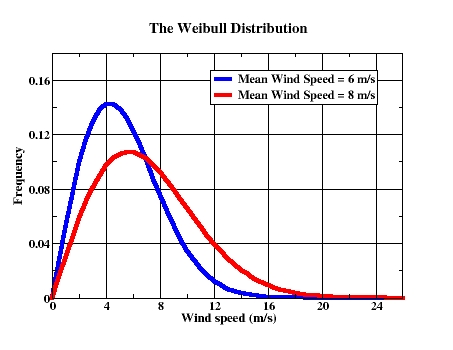
This approximate distribution is used for the turbine formula instead of the full histogram which greatly simplifies the calculation of the wind turbine power output.
T3Q4 - What is the Use factor obtained as a result of the turbine formula?
The Use factor is the ratio of the computed power output with the maximum power output of the turbine.
Topic 4 -MID/MIF and RPN files
T4Q1 - Why are the tiles in the MID/MIF or RPN files bigger than the ones displayed on the web site? The tiles have an overlap, is it normal?
The tiles have a 40% overlap. In order to display the tiles on the web site, we cut them in the middle of the overlap regions, removing 20% of the points (34 points) on each side. On the contrary, the MID/MIF and RPN files contain the complete tiles (174x174 points) and an overlap is observed as neighbouring tiles are visualized together.
Important notice: 13 points on the edge of each tile contain data required in our computing method but that should not be used in the analysis. It is even recommended to drop some more points on the edge in order to make sure that the data that are used are not too much influenced by the boundary conditions.
T4Q2 - What variables are available in the MID/MIF and in the RPN files?
The variables computed by statistical processing of the simulation results are defined in the page: Variables computed by statistical post-processing
The RPN format is a proprietary binary format. The Mapinfo Interchange Format is a simple ASCII format supported by most GIS software. The MID/MIF files were obtained by processing the RPN files.
The MID files are column files and contain seven variables, the first two (E1 and EU) being the results of the statistical processing and the five others being related to the input data:
- E1 (W/m2), mean wind power,
- EU (m/s), mean wind speed,
- ME (m), topography,
- MG, land/water mask (1=land, 0=water),
- 2B (m), rugosity length,
- LA, latitude,
- LO, longitude given between 0 and 360°.
The MIF files contain the meta-data corresponding to the MID files. The MIF file Data section defines the grid. The MIF file Header section includes the Coordsys clause which describes the projection used and the mathematical approximation of the earth's shape and orientation.
The RPN files are more complete. They contain all the results of
the statistical processing. Applying the fst2bin
software tool to RPN files, one binary file is obtained for each variable,
representing 447 files:
| Generic name (See the definitions) | Content | Number of files |
|---|---|---|
| E1-A-12011-000-000-00000000-CAN___50 |
1 |
|
| E2-A-12011-000-000-00000000-CAN___50 |
1 |
|
| EC-A-000#-000-000-00000000-CAN___50 |
#=1-8 wind power classes. class 1= 0 < power < 200 class 2= 0 < power < 300 class 3= 0 < power < 400 ... |
8 |
| EH-A-000#-000-000-00000000-CAN___50 | #=1-8 wind power classes. class 1= 0 < power < 200 class 2= 200 < power < 300 ... |
8 |
| EN-A-12011-000-000-00000000-CAN___50 |
1 |
|
| ER-A-0###-000-000-00000000-CAN___50 |
###=000-360 wind direction sector |
13 |
| ERN-A-0###-000-000-00000000-CAN___50 | ###=000-360 wind direction sector | 13 |
| EU-A-12011-000-050-00000000-CAN___50 |
1 |
|
| EU2-A-12011-000-000-00000000-CAN___50 |
1 |
|
| UH-A-00##-000-000-00000000-CAN___50 |
##=00-26 wind speed classes |
27 |
| UHR-A-0###-0&&-001-00000000-CAN___50 |
###=000-360 wind direction sector &&=00-26 wind speed classes |
351 (27x13) |
| UR-A-0###-000-000-00000000-CAN___50 |
###=000-360 wind direction sector | 13 |
| UU-A-12011-000-000-00000000-CAN___50 |
1 |
|
| VV-A-12011-000-000-00000000-CAN___50 |
1 |
|
| >>-X-00##-0&&-&&0##-00000000-POS_X |
## i tile index, && j
tile index X Positions of the 174x174 simulation grid points |
1 |
| >>-X-00##-0&&-&&0##-00000000-POS_Y | ## i tile index, && j
tile index Y Positions of the 174x174 simulation grid points |
1 |
| ME-P-0000-009-000-10198000-CAN1D090C10M | Topography |
1 |
| >>-X-00##-0&&-&&0**-00000000-POS_X |
## i tile index, && j
tile index, ** i+1 X Positions of the 168x168 geophysical data grid points |
1 |
| >>-X-00##-0&&-&&0**-00000000-POS_Y | ## i tile index, && j
tile index, ** i+1 Y Positions of the 168x168 geophysical data grid points |
1 |
| 2B-P-0000-000-000-10198000-CAN1D090C10M |
Rugosity - Defined on the 168x168 geophysical data grid | 1 |
| MG-P-0000-000-000-10198000-CAN1D090C10M |
Land/water mask - Defined on the 168x168 geophysical data grid | 1 |
Remarks:
- In the RPN files, the geophysical input fields (2B et MG) are defined on a different grid (the 168x168 geophysical data grid which is a subset of the simulation grid). When generating the MID/MIF files, these variables were extended on the 174x174 simulation grid.
- The Latitude/Longitude are not available in the RPN files. They were computed from the (X,Y) positions and placed in the MID files.
- For the classification by wind direction sectors, the useful classes are 0, 30, 60, 90, 120, 150, 180, 210, 240, 270, 300, 310. The 360 sector contain the cumulative value of the other sectors.
T4Q3 - Are the data contained in the MID/MIF and in the RPN files the same?
Yes. In fact the MID files are generated from the RPN files. However:
- the RPN files contain more information and are therefore much bigger (see T4Q2),
- the (lat,long) coordinates are available in the MID files while the RPN files presents (x,y) coordinates,
- the rugosity and the land/water mask are not defined in the same grid as other variables in the RPN file.
T4Q4 - What is the Coordsys clause specified at the head of the MIF files?
The Coordsys clause
CoordSys Earth Projection 20, 999, 12, 0,
0, 0, 7, -100.0000 , 90, 0.9330127, 0, 0
describes the mathematical approximation of the earth's shape and
orientation. It reads:
| Projection 20 |
Stereographics projection |
| 999 |
custom datum with shift
parameters only (no rotation, no scale correction) |
| 12 |
datum ellipsoid number, refers
to a sphere |
| 0, 0, 0 |
datum X,Y, Z shifts |
| 7 |
unit = meter |
| -100.0000 | longitude of the origin (# 100° W) |
| 90 | latitude of the origin (# 90° N) |
| 0.9330127 | scale factor (adjusted to have a true scale at 60° N) |
| 0 |
false easting |
| 0 |
false northing |
T4Q5 - What is the procedure of import in MapInfo of the downloaded MID/MIF files ?
Although the MID/MIF format is the MapInfo Interchange Format, the import procedure is not direct. In addition and from our experience, not following the import procedure described below may lead to severe positioning errors (10 km) when the Atlas data are overlaid with data from other sources defined on a non-spherical datum (NAD83, WGS84, NAD27 ...).
1st step: MIF to TAB Import- Table > Import, Files of Type MapInfo Interchange (.mif), select the downloaded .mif file
- A new table file is created
2nd step: Projection in Longitude/Latitude, datumless
- File > Open and select table created in the 1st step
- File > Save Copy As
- Click on the Projection button in the Save Copy of Table As window
- In the Choose Projection window, select Category = Longitude / Latitude, Category Members = Longitude / Latitude
- Save the result in a new table .tab file
This setting corresponds to the MapInfo longitude/latitude datumless (not attached to a particular datum) reference system. The table created in the 2nd step can be projected in any other reference system and overlaid with other data.
T4Q6 - What is the procedure of import in ArcGIS of the downloaded MID/MIF files ?
In ArcGIS 9, a conversion tool box is available from ArcCatalog and proposes a choice of conversions from external format. In particular, the conversion from MIF to Shapefile can be performed using this tool box.
With older version of ESRI software, a MIF2Shape converter may be available as a separate script.
1st step: MIF to Shape Import- Using MIF to Shapefile from ArcCatalog's Conversion Tools menu
- The conversion is straightforward and produces 3 files: ***.dbf, ***.shp and ***.shx where *** represents the user specified file name
(limitation: the path to the input file and the name of the output file should not include special characters like "-" ).
2nd step: Define the projection fileIn order to use the resulting shape file in the ArcGIS software suite, one has to define the geographic reference system of the imported data. As a matter of fact, the CoordSys clause included in the MIF file is actually not used by ArcGIS. This information has to be provided in a separate file ***.prj having the same name as the ***.dbf, ***.shp and ***.shx files.
This .prj file is made of one line and is very similar to the CoordSys
clause of the .mif file. For the Canadian Wind Atlas data, this file
contains in particular the following information:
| "Sphere",6371000.0 | The datum is a sphere of radius 6371000.0 m |
| "Stereographic" | Stereographic projection |
| "Central_Meridian",-100.0 | Central meridian at 100 degrees West |
| "Latitude_Of_Origin",90.0 | The initial projection plane is the north polar plane at latittude 90 degrees |
| "Scale_Factor",0.9330127 | This factor rescale the data projected in the north polar plane in order to have the final data projected in the 60 degrees north plane. |
You can use the example .prj file available here.
- Date modified: